Dashboard
The WCS Dashboard provides a comprehensive and real-time visualization of key operational metrics, allowing users to monitor task statuses, equipment performance, and handle exceptions efficiently. This interface is designed to support both warehouse supervisors and equipment operators in daily operational oversight.
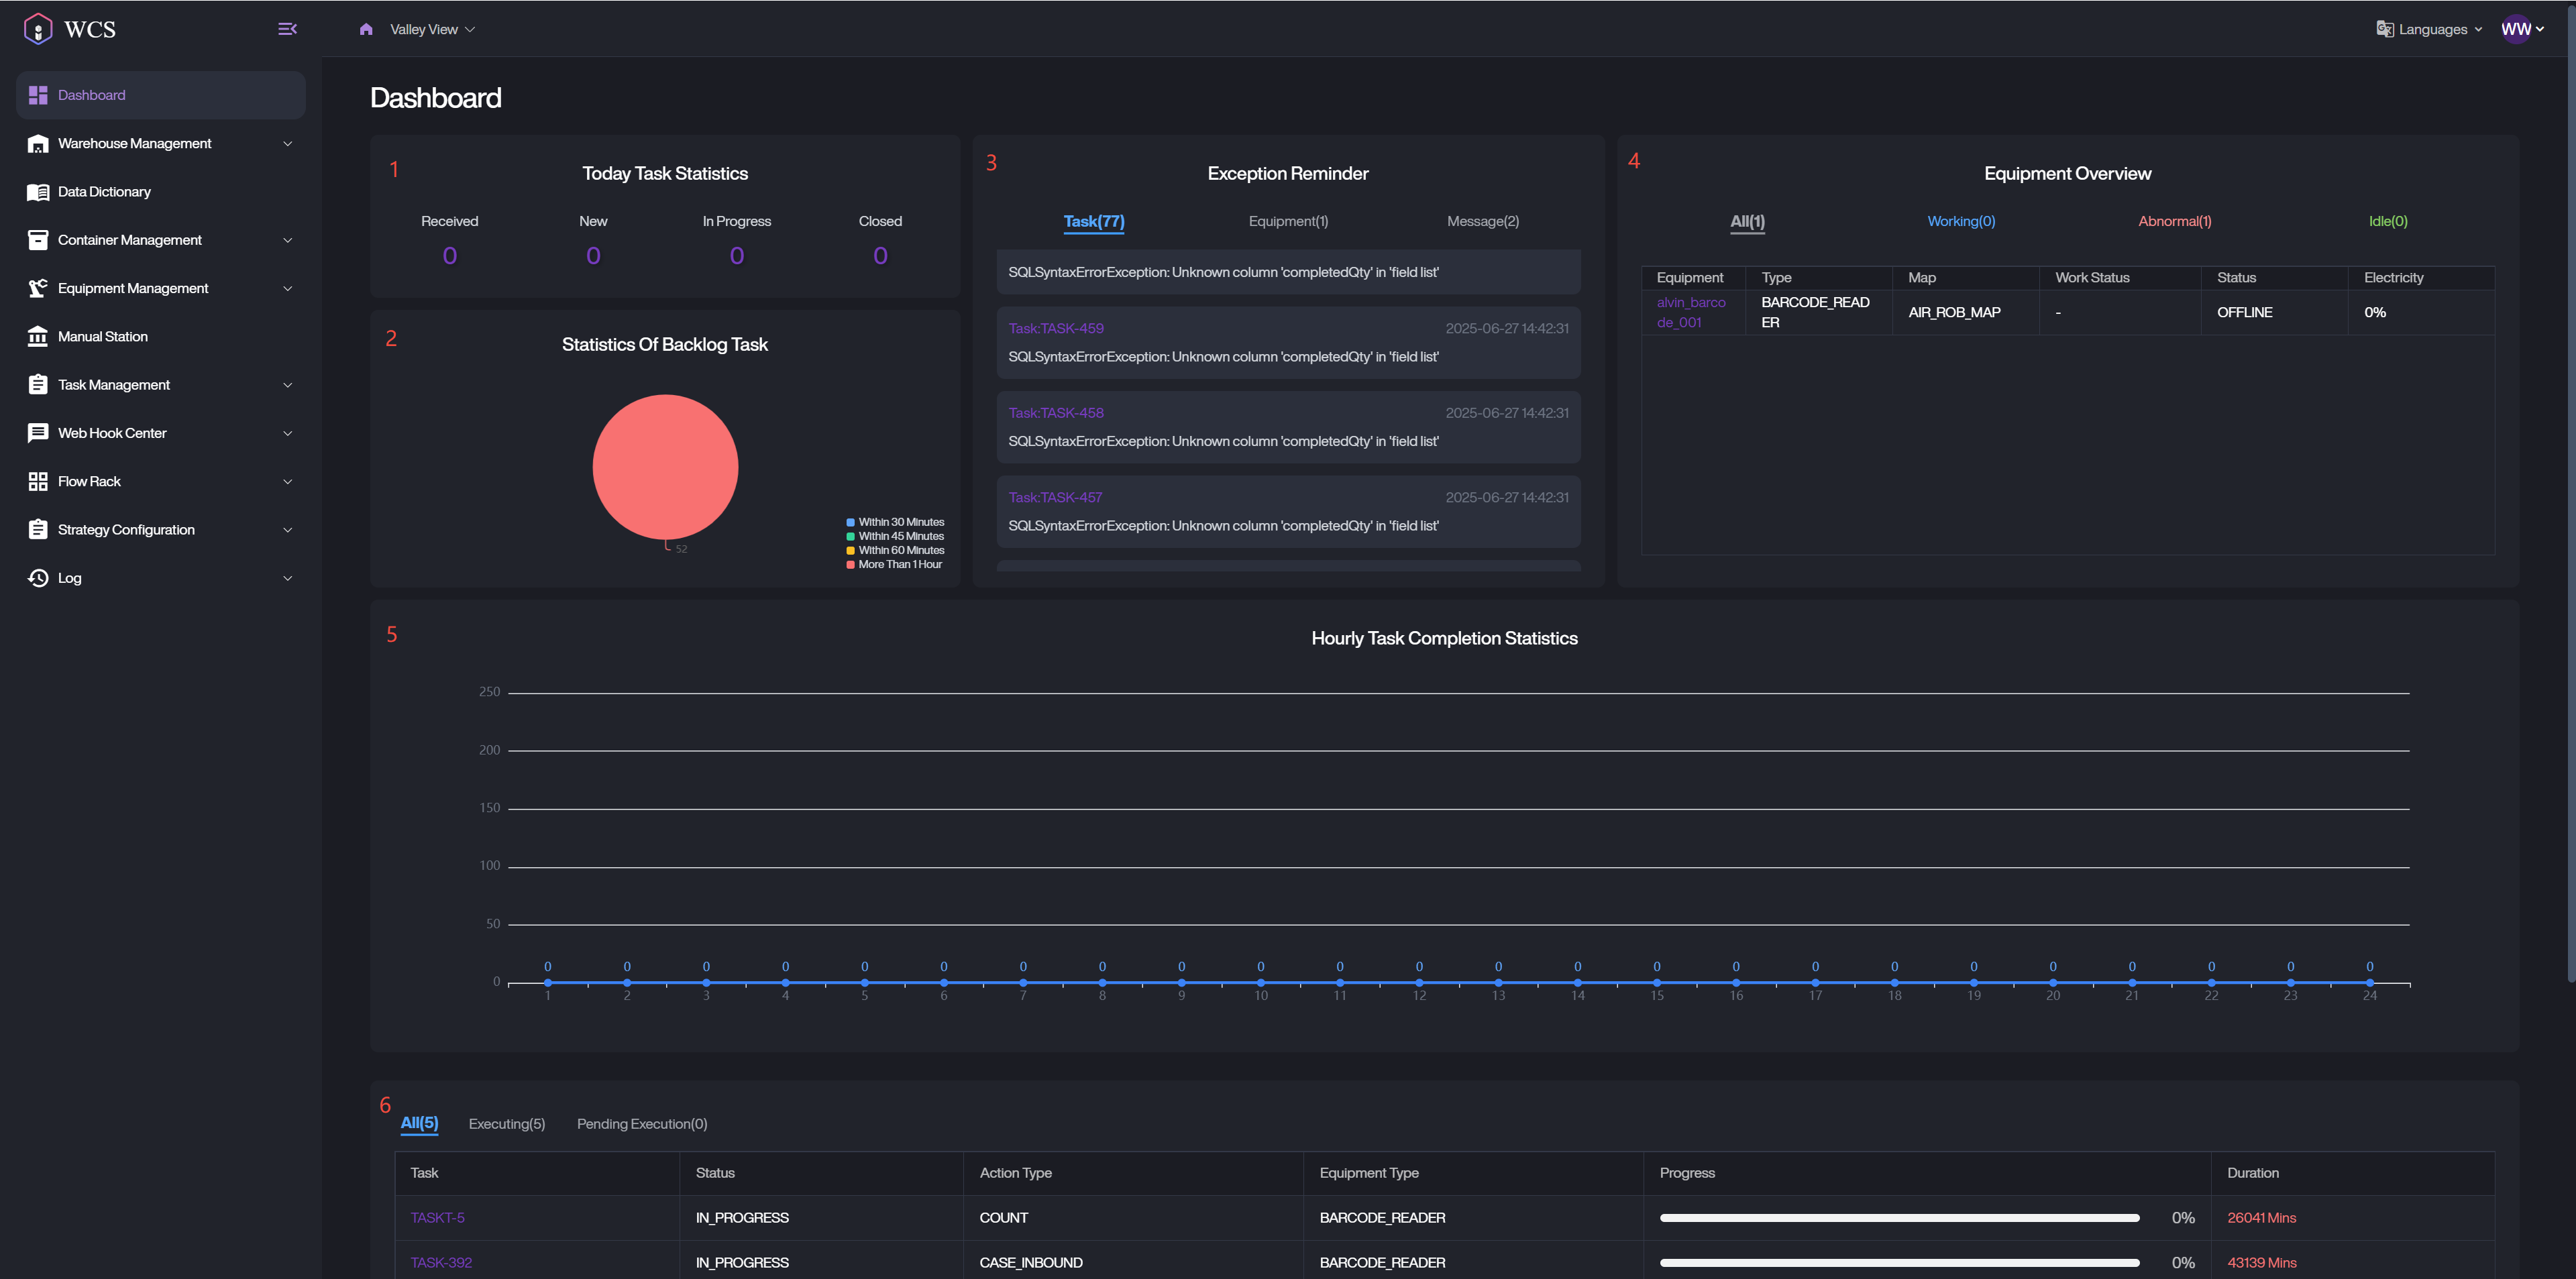
Today Task Statistics
This section displays a summary of task processing for the current day, categorized into four key statuses.
Received: Total number of tasks accepted from upstream systems.
New: Tasks that have been assigned but not yet started.
In Progress: Tasks currently being executed by warehouse equipment.
Closed: Tasks that have been successfully completed.
Statistics Of Bocklog Task
The pie chart provides a visual distribution of backlog tasks based on elapsed time since creation.
Within 30 Minutes
Within 45 Minutes
Within 60 Minutes
More than 1 hour
This helps users quickly identify time-sensitive delays and take appropriate action.
Exception Reminders
The Exception Reminders module displays categorized system and operational anomalies across three tabs:
Task: Summarizes the failures of steps, tasks, and actions according to the failure status.
Equipment: List records with an equipment status of abnormal.
Message: Contains records with a message status of failed.
Clicking on an exception entry will redirect users to the corresponding detailed list view.
Equipment Overview
This section provides a real-time status overview of warehouse equipment. Users can navigate through four status-based tabs.
All: Includes all equipment regardless of status.
Working: Equipment with status Working or Charging.
Abnormal: Equipment with status Abnormal or Offline.
Idle: Equipment with status Idle.
Hourly Task Completion Statistics
This chart shows the number of completed tasks over the past 12 hours, broken down by hour.
X-Axis: Hourly time intervals (e.g., 00:00–01:00, 01:00–02:00, etc.).
Y-Axis: Number of completed tasks within each hour.
Each data point reflects the number of tasks completed during that specific one-hour window.
Clicking on any number will open the task list page filtered to show the relevant data.
Task Execution Tracking
The Task Execution Tracking section visualizes pending and ongoing executions at the action, task, and step levels. It allows users to trace the lifecycle of a given task from start to completion. This module helps supervisors identify bottlenecks and evaluate the real-time execution flow of critical operations.
Data Scope: Includes all records from the task list, excluding those with statuses Finished, Failed, or Cancelled.
Status Classification:
-
Pending: Includes tasks with Initialization, DecisionOn, or Unassigned.
-
Executing: Includes tasks with status Executing.